
![]() By Lia Webster*, with support from EVO’s Focus Group on COVID-19**
By Lia Webster*, with support from EVO’s Focus Group on COVID-19**
The pandemic caused by COVID-19 has affected everyone, creating a variety of critical issues and difficulties worldwide, and energy reduction projects are no exception. The health crisis has disrupted economies and initially resulted in dramatic and rapid decreases in global energy use, with impacts ongoing. Similarly, facility energy use patterns have shifted due to changes in site-level operations (e.g., operating hours and number of occupants) resulting in fundamental issues for some measurement and verification (M&V) efforts. The primary M&V-related concern due to these unexpected changes is substantially over- or under- estimating savings from the targeted energy efficiency measures (EEMs).
Although COVID-induced changes are generally unrelated to energy efficiency projects, they can directly impact the operation of EEMs and can hinder an equitable “apples to apples” comparison of energy use between the baseline period and a reporting period needed to determine savings, as required in IPMVP. All M&V methods may be impacted, but meter-based M&V methods (e.g., IPMVP Option C) face unique challenges from the COVID pandemic because changes in whole-building energy use directly impact calculated energy savings. Although potentially less dramatic to observe, retrofit isolation M&V methods (e.g., IPMVP Options A & B) are also impacted by site-level changes resulting from the pandemic. In the context of measurement and verification (M&V) efforts, COVID has caused widespread non-routine events!
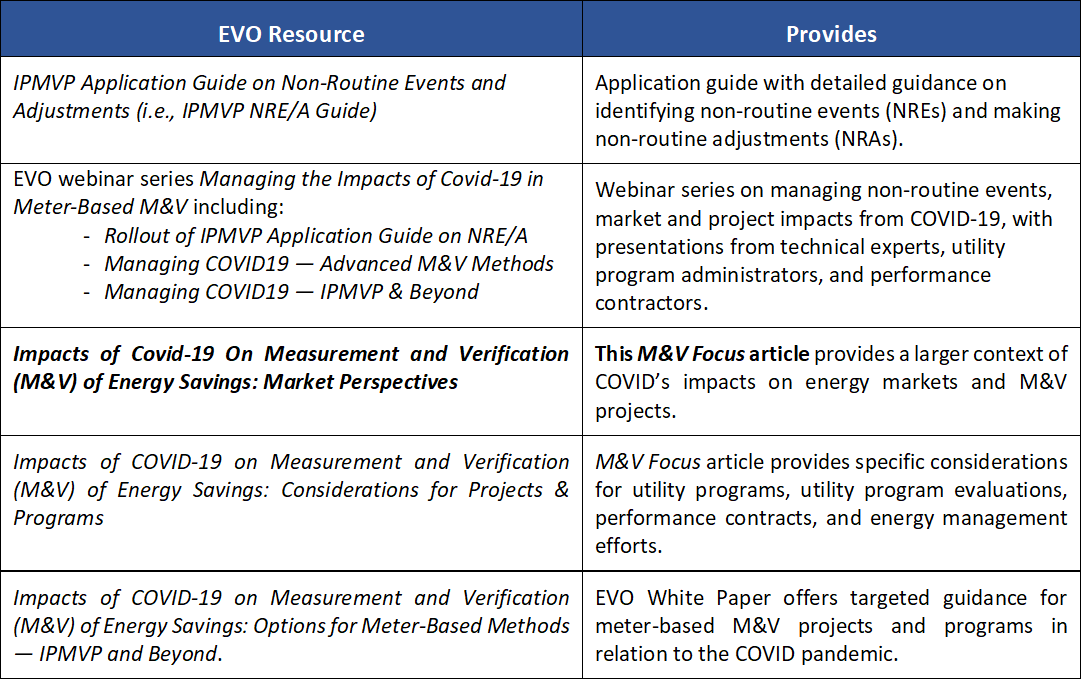
Fortunately, solutions are available. The recent publication of EVO's IPMVP Application Guide on Non-Routine Events and Adjustments (IPMVP’s NRE/A Guide)1 provides a road map and details a variety of solutions that are effective and allow energy savings to be accurately determined despite the impacts from non-routine events (NREs) such as those caused by COVID. Given the complexities faced by the industry, EVO’s Focus Group on COVID-192 has developed several resources intended to provide guidance on risks and options for projects and programs, including hosting a webinar series, providing two articles in this M&V Focus, and developing a technical white paper, as summarized in the table below.
Summary of Resources on Managing COVID-19 from Efficiency Valuation Organization (EVO)
Global Energy Consumption Decreases
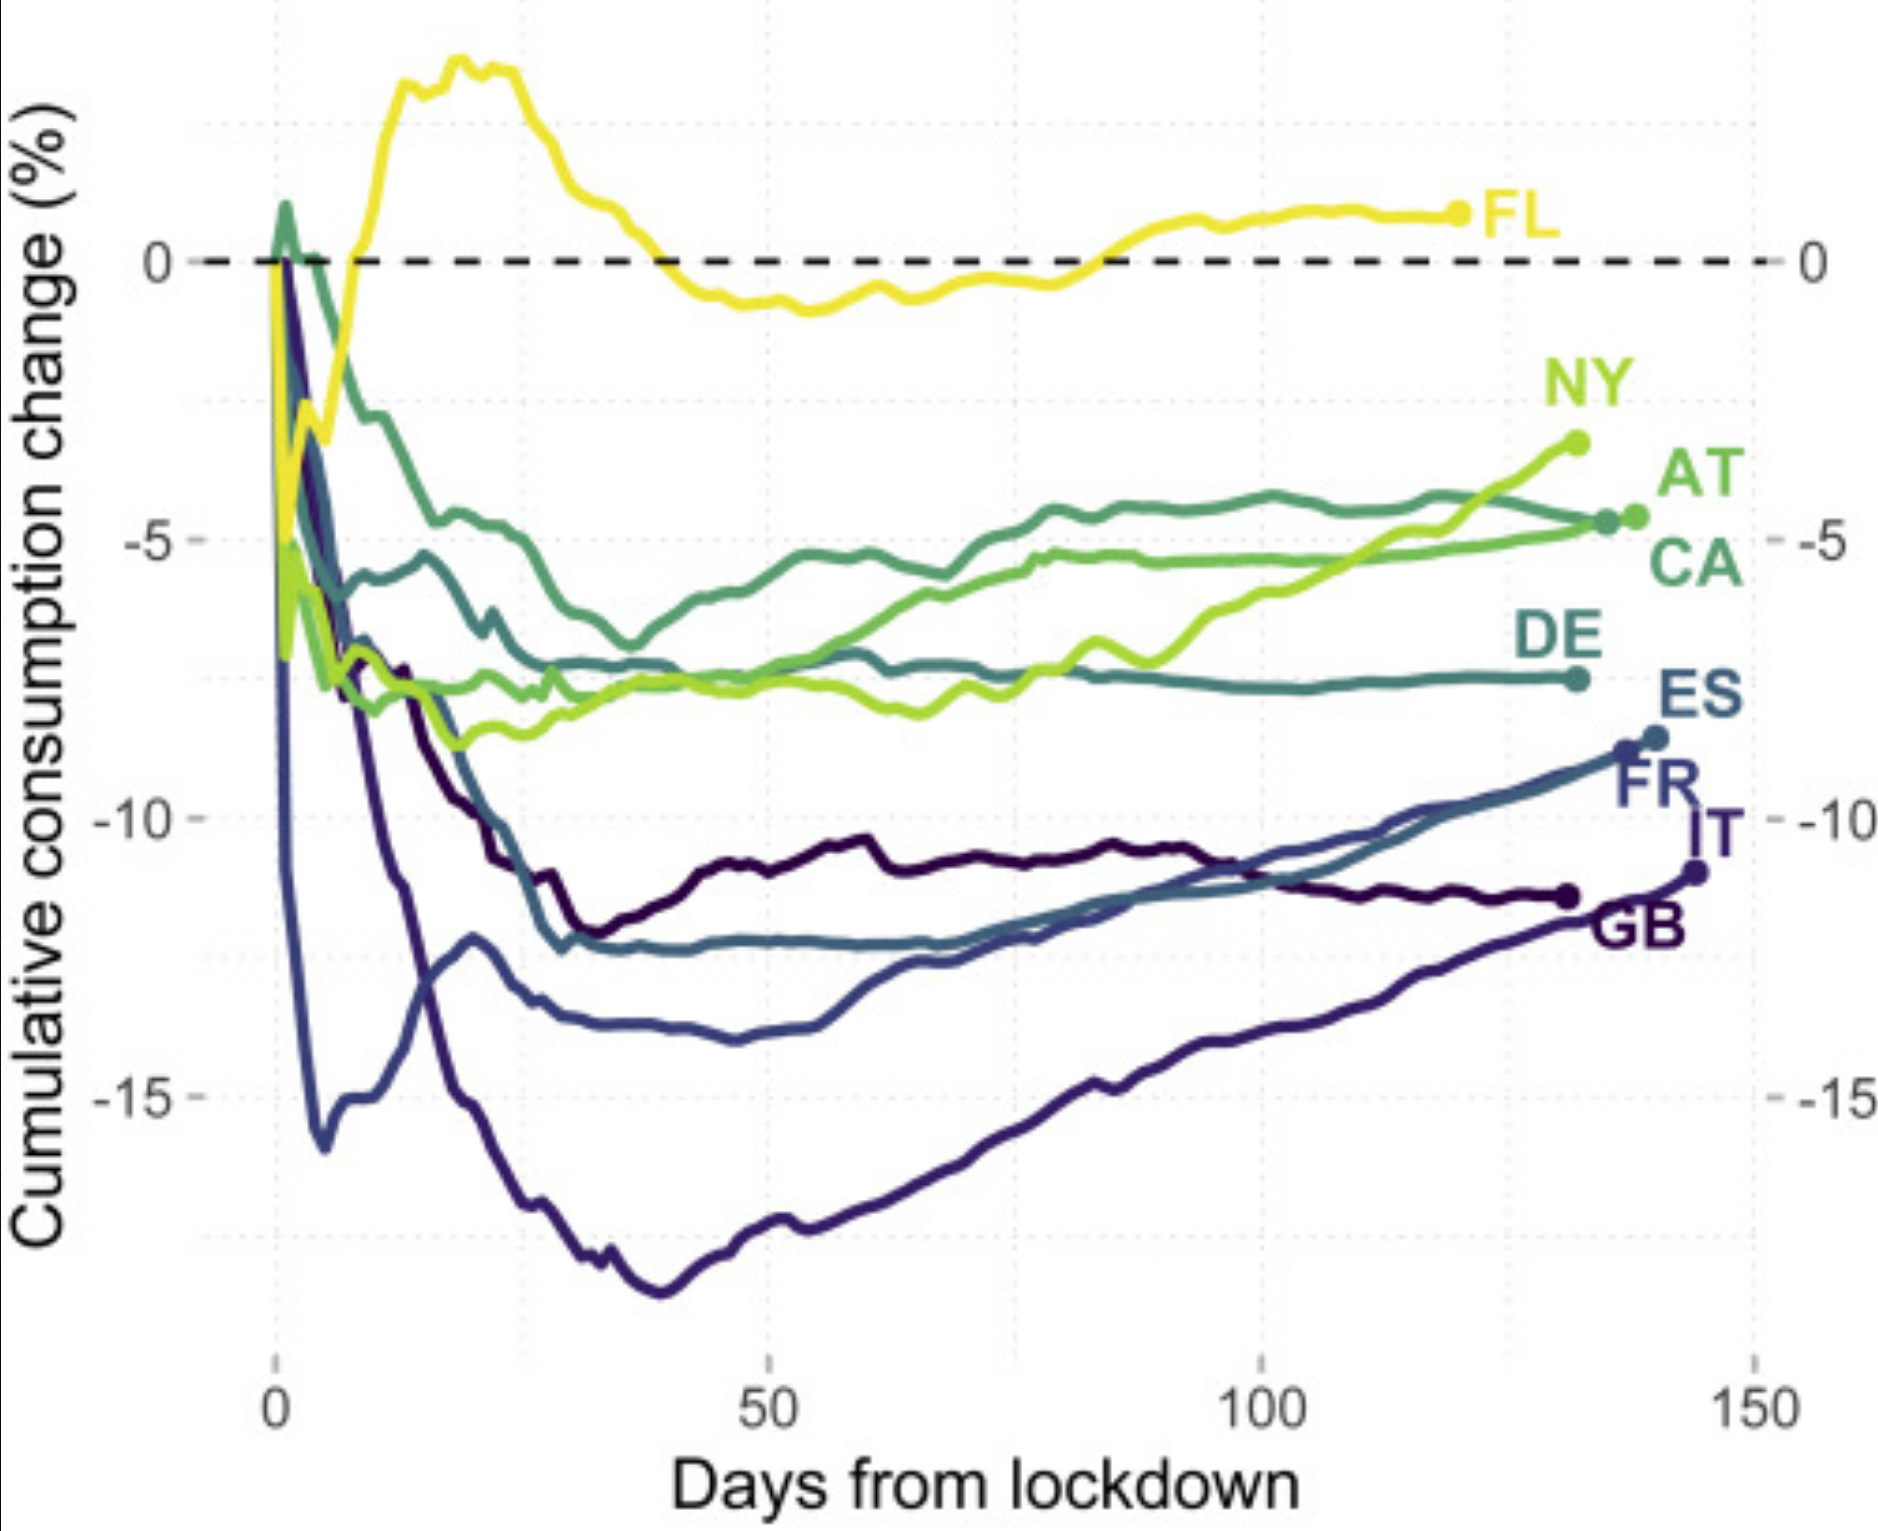
Significant decreases in energy consumption have been observed across the world and have impacted all sectors and types of facilities3. Overall changes in energy consumption resulting from stay-at-home orders, travel bans, and similar initiatives have been dramatic. Figure 1 shows the changes in total energy consumption immediately following regional lockdowns, which have been generally consistent. For example, strict lockdowns in Italy and Spain resulted in decreases in energy consumption of more than 15% initially. Similarly, electricity demand in many areas of the United States saw declines of 9 – 13% in March and April 2020, slightly less than the 11 – 14% decline seen in New York state. In contrast, other areas of the country such as Florida did not experience significant changes.
Figure 1: Change in Energy Consumption by Region
(FL, Florida; NY, New York; AT, Austria; CA, California; DE, Germany; ES, Spain; FR, France; IT, Italy; GB, Great Britain)4
Most impacts in the US began in March 2020, although the timing and level of impacts from COVID on energy use varies significantly by region and sector, with additional differences seen at individual sites. According to the U.S. Energy Information Administration’s (EIA)5, residential electricity sales in the United States increased 8% in April 2020 compared with April 2019. At the same time, the commercial and industrial sectors saw short-term decreases in total purchased electricity of 11% and 9%, respectively.
Impacts vary by region and can be further delineated by Independent System Operators and Regional Transmission Organizations (RTOs/ISOs) analyses comparing actual consumption to weather adjusted forecasts. For example, Midcontinent Independent System Operator (MISO) reported decreases in electricity consumption of 11%–16% from late March through April, corresponding to the temporary closures of major manufacturing facilities in Michigan6.
Efforts to Mitigate Transmission of COVID
Driven by local directives or organizational responses, many facilities have been significantly impacted by COVID, with shifts in both operating hours and levels of occupancy, including the related energy loads. Many are operating at reduced capacity and have been fully or partially closed at times, with some becoming vacant. Other facilities have seen increased hours and loads or have been altogether repurposed (e.g., offices to apartments)7 .
The time-series charts below show the average electricity use over the two-year period from 2018 to 2020 for various building types based on a random sample of 200 facilities from a utility in the Midwestern United States8. The period since COVID impacts began is highlighted (March 2020 through December 2020). Depending on the facility type, impacts are evident often shifting load curves down with lesser impacts typical during weekends than weekdays (e.g., 30% decrease in weekdays, 10% in weekends).
Figure 2: Average Energy Use Patterns for 2018 to 2020 by Building Type
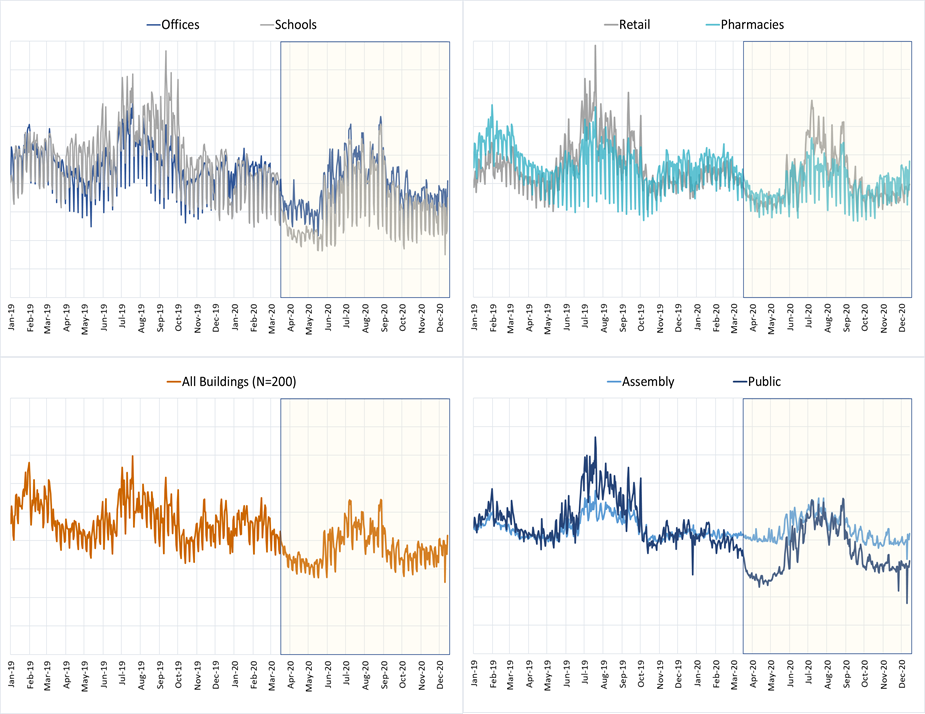
These energy use profiles illustrate the diversity of impacts by sector as well as how difficult it may be to differentiate COVID impacts on energy use from those due to weather variation and extremes, highlighting the importance of site-specific analysis. As detailed in the IPMVP NRE/A Guide, significant irregularities in site-level energy use caused by COVID can be discerned through statistical analyses of energy data and assessments of changes to site-level factors such as lighting loads and schedules, occupancy loads and schedules, ventilation loads, etcetera9.
Figure 3 – Phases of Energy Changes Due to COVID Directives at One Restaurant in California
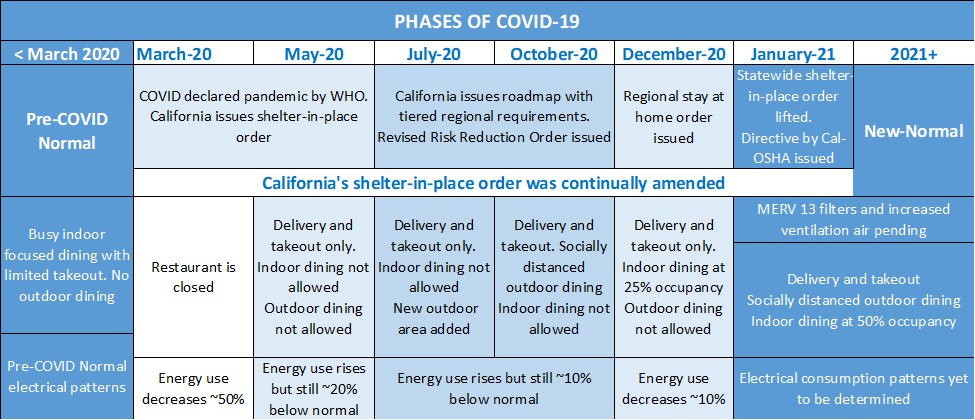
Facilities continue to experience a wide range of overall energy impacts from COVID. Figure 3 illustrates the ongoing operational changes made at one restaurant in California due to State and regional directives. These phases included an initial period of being completely shut down, followed by operating at reduced hours under morphing restrictions (e.g., takeout-only, indoor-dining allowed with reduced occupancy levels) and result in changes in energy consumption. Currently, work to modify ventilation rates is pending implementation to meet a new Cal/OSHA mandate, leaving the long-term post-COVID normal occupancy and electrical use patterns yet to be determined for this facility. This is one scenario, when in fact, each building will likely go through a different set of operational phases which may be simple but can create unique energy use patterns. This is a significant challenge for M&V efforts which rely on whole building energy use.
Impacts to meter-based M&V efforts will vary depending on the timing of COVID’s impacts on the project (e.g., baseline, implementation, or reporting periods).
If affected during the M&V reporting period, for example, all reductions in site energy during this period would appear as EEM savings when they may in fact be partially attributable to non-existent “COVID Savings” (i.e., energy reduction due to unrelated causes). Similarly, increases in energy use due to changes unrelated to the EEMs could inappropriately appear as a loss of savings or "COVID Penalties”. Similar savings valuation issues arise for projects where COVID impacts begin during the baseline or implementation period.
Long-Term Mitigation Efforts Increase Facility Energy Consumption
Another significant complication for regaining ‘pre-COVID normal’ energy consumption patterns are retrofits being made to mechanical systems to address long-term indoor environmental concerns. Updated recommendations to maintain health and safety in buildings have been issued from organizations such as the World Health Organization (WHO), Centers for Disease Control (CDC) and ASHRAE10. Key suggestions include increasing ventilation rates, using air-purge strategies, improving air filtration systems, improving automated controls, and using ultraviolet germicidal irradiation (UVGI) technologies. New York state is examining the feasibility and energy impacts of these mitigation strategies in 83 specific facilities based on site feasibility assessments and calibrated building simulation models11. Depending upon the building type, location, and solutions recommended, the impacts on overall energy consumption can be significant (i.e., estimated increases ranged from 10% to 40%) although moderated by necessary retro-commissioning improvements.
Efforts to limit transmission of the virus vary, but many sites have existing systems that cannot accommodate the recommendations. For example, increasing ventilation rates intensifies heating and cooling loads and may not be feasible at all times due to limits in equipment capacity, especially in extremely hot or cold climates. In many instances, unplanned system upgrades are not possible, and a variety of temporary solutions may be pursued such as space heaters and portable air filtration systems. Temporary mitigation strategies for building occupancy have been required in some areas12 and may be permanently adopted.
More to Come
It is unclear if implementation of these health-based strategies will continue as people’s awareness of issues related to indoor air quality is piqued or wane along with concerns of virus transmission as vaccinations become prevalent and prove effective. The future long-term operating conditions and energy use patterns for many facilities impacted by COVID are also yet to be determined and the persistence of impacts will likely vary by region and facility type. Individual M&V efforts will need to ascertain impacts at each facility to determine the appropriate path forward.
Figure 4: U.S. Electricity Consumption Percent Growth Projected by EIA13 Based on Economic Growth Scenario
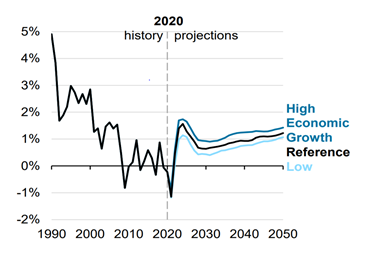
Significant factors impacting the return to a pre-COVID normal include the overall pace of the economic recovery as well as outcomes of current trends such as working remotely and moving out of cities. Current EIA forecasts that consumption of electricity in the United States will increase by 1.6% in 2021 after falling 3.8% in 2020, and projects that electricity demand will largely return to 2019 levels by 2025, depending on economic conditions14. The rates of the rebound in energy consumption vary considerably internationally, with some countries such as China and India15 showing more robust recovery than others.
If COVID results in long term shifts (i.e., a new-normal) in overall energy consumption patterns, potential issues similar to those faced in individual M&V efforts may arise regarding the accuracy of regional energy consumption forecasts, greenhouse gas projections, and transportation planning, among others. Specific considerations for performance contracts, energy management efforts, utility program reporting, and program evaluations are discussed in a follow-on article — Impacts of COVID-19 on Measurement and Verification (M&V) of Energy Savings: Considerations for Projects & Programs.
REFERENCES
1) Webster, L., et. al., IPMVP Application Guide on Non-Routine Events and Adjustments, EVO 10400-1:2020 , October 2020.
2) EVO’s Focus Group on COVID-19 met from May 2020 through February 2021. Led by Lia Webster, the group included Todd Amundson, Anna Kelly, Dan Bertini, David Jump, Emily Cross, Colm Otten, Denis Tanguay, Abigail Hotaling, Faith DeBolt, Eva Urbatsch, Steve Kromer, Eliot Crowe, Greg Anderson, Patrick O'Shei, Brian Clipper, Lionel Metchop, as well as others.
3) International Energy Agency (IEA), Year-on-year change in weekly electricity demand, weather corrected, in selected countries, January-December 2020, IEA.
4) Source: López Prol, Javier et al., Impact of COVID-19 Measures on Short-Term Electricity Consumption in the Most Affected EU Countries and USA States, iScience, October 2020.
5) US Department of Energy Information Administration (EIA), Short Term Energy Outlook, February 9, 2021.
6) EIA analyses. Other researchers have developed regression-based models which correlate COVID’s early impacts on electricity consumption by region based on COVID cases and other location-based data. See Texas A&M University’s research report linked here.
7) See National Association of Industrial and Office Properties (NAIOP).
8) Data analysis provided by Anna Kelly and Craig Sinnamon from Power TakeOff.
9) Methods to identify energy anomalies are detailed in IPMVP Application Guide on Non-Routine Events and Adjustments link to NRE/A Guide, EVO 10400-1:2020, October 2020.
10) See guidance from WHO, Centers for Disease Control, and the American Society of Heating Cooling and Refrigeration Engineers (ASHRAE) and analysis by Taylor Engineering.
11) New York State Energy Research & Development Authority (NYSERDA) is evaluating Tier 1, 2, and 3 measures to improve indoor air quality for a portfolio of specific buildings.
12) Both CA and NY have adopted additional temporary requirements for building occupancy.
13) Sources: U.S. Energy Information Administration (EIA) Annual Energy Outlook 2021 Press Release; EIA Short-Term Energy Outlook, February 9, 2021.
14) EIA Today in Energy, February 3, 2021.
15) [1] See International Energy Agency (IEA) COVID-19 Impact on Electricity.

(*) Lia Webster, PE, CCP, is Principal at Facility Energy Solutions
(**) EVO’s Focus Group on COVID-19 met from May 2020 through February 2021. Led by Lia Webster, the group included Todd Amundson, Anna Kelly, Dan Bertini, David Jump, Emily Cross, Colm Otten, Denis Tanguay, Abigail Hotaling, Faith DeBolt, Eva Urbatsch, Steve Kromer, Eliot Crowe, Greg Anderson, Patrick O'Shei, Brian Clippinger, Lionel Metchop, as well as others.