
By Sotiris Papadelis*
The SRI2MARKET project was funded by the European LIFE Clean Energy Transition program to improve the knowledge and capabilities of European Union (EU) Member States with regards to the introduction of the Smart Readiness Indicator (SRI) in their national regulation and market.
The SRI is a European Commission initiative that measures a building's ability to use smart technologies. These technologies aid in decarbonization, while also offering more comfortable and efficient living environments. The smartness of a building refers to its ability to sense, interpret, communicate and actively respond in an efficient manner to changing conditions in relation to the operation of technical building systems, the external environment and the demands from building occupants.
Introduction
An SRI assessment starts with determining which services are present in a building. These are subdivided into multiple domains (e.g. heating, ventilation, lighting, electric vehicle charging, etc.). Subsequently, an evaluation of the degrees of smartness (referred to as functionality levels) of these services is made. Next, an impact score is calculated based on predetermined impact criteria (energy savings, comfort improvements, flexibility towards the energy grid, etc.). Finally, these impacts and functionalities are aggregated into an overall score reflecting the smart readiness of a building.
The official EU page for the SRI - https://energy.ec.europa.eu/topics/energy-efficiency/energy-performance-buildings/smart-readiness-indicator_en - includes a wealth of information on the indicator, its utility, and tools that are freely available for its calculation. In addition, the SRI2MARKET web site - https://sri2market.eu/ - provides access to two (2) important tools:
- An e-learning platform that includes educational material on the different services and functionality levels that are under the scope of the SRI indicator
- A web-based tool for conducting SRI audits and calculating the SRI rating of a building.
With the goal of supporting service providers in creating customer offers and running business models for SRI improvements, a set of methods for estimating and verifying energy savings expectations were implemented as a web-based application. This application is called Meval4SRI and is freely accessible at https://mevalapp.com/.
1. The Meval4SRI application
The Meval4SRI application is built around the following flow of tasks:
- Add a new building or edit an existing one. Every piece of user input that is related to systems, events, meter data and SRI upgrades is tied to a specific building.
- Create thermal zones. The application regards any data source that is provided by the users as a link between a piece of infrastructure (sensors, meters and HVAC systems) and a thermal zone.
- Create HVAC systems. The application allocates all features and energy consumption data to the HVAC systems in a building.
- Create events. The application supports three (3) event types :
- Efficiency upgrades. These events correspond to improvements in the characteristics and control capabilities of the HVAC systems of the building.
- Activity shifts. These events reflect a shift in the way an existing system is used (such as different temperature setpoints or different number of heating/cooling hours) or a shift in the context of the system’s operation (such as a higher or lower number of occupants during peak hours).
- Transient events. These events connect two distinct operating conditions of the building, and their data are excluded from the impact analysis.
- Add time series data for the building. All calculations are based on actual data from the buildings. In this way, the results are specifically relevant for each building: (a) data before the upgrade are used to set accurate expectations about the upgrade and (b) data after the upgrade are used to appropriately adjust the expectations and estimate the actual impact from the improvements.
- Add data features. The application does not prescribe the names of the user-provided features, but it expects that the features found in the uploaded time series are defined and typed before any calculations are carried out:
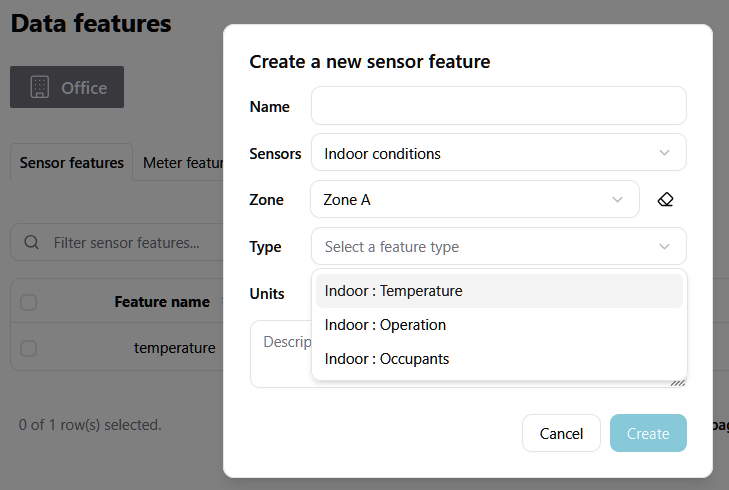
Fig. 1 – Defining a new feature
- Define the system upgrades. Energy savings are estimated for systems that are upgraded.
- Train and apply the underlying predictive model. The predictive model is trained using the baseline period data and it can be utilized each time new data from the reporting period are available:
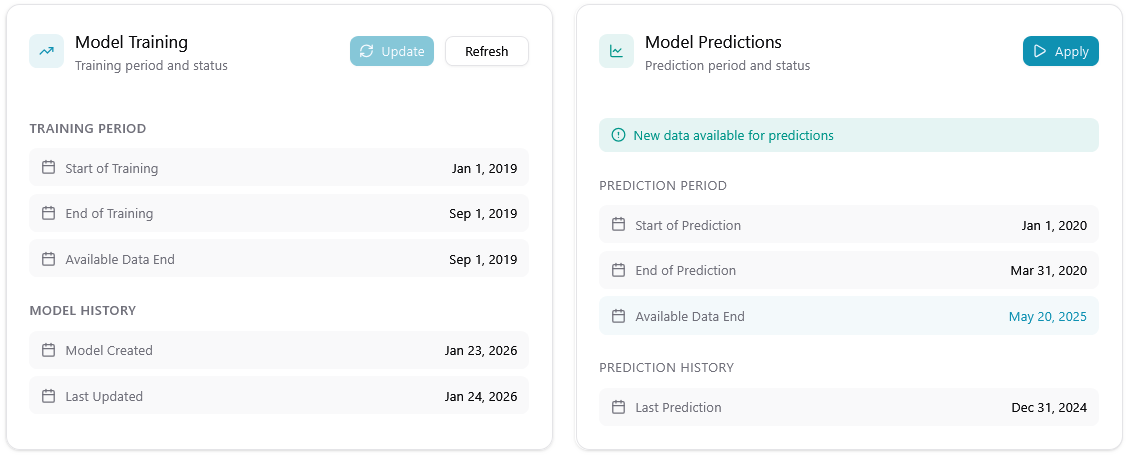
Fig. 2 – Management of the predictive model
The following figure shows all the steps that are available in the Meval4SRI workflow:
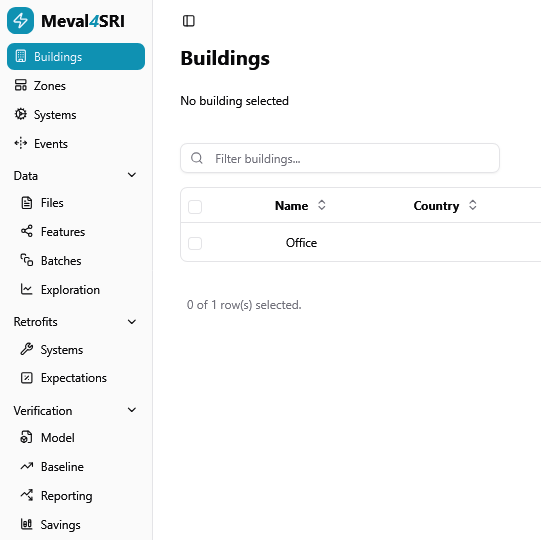
Fig. 3 – The Meval4SRI workflow
2. The predictive model of Meval4SRI
The TOWT model
The Time-of-Week and Temperature (TOWT) model is a regression-based baseline modelling approach widely used to estimate counterfactual energy consumption, i.e. the energy consumption of a building had the retrofit not taken place.
The TOWT model decomposes energy consumption into two components:
- Time-dependent operational effects, represented by discrete time-of-week indicators, and
- Weather-dependent effects, represented by temperature response functions.
Time-of-week effects are modelled using a set of categorical indicator variables that partition the week into fixed intervals (usually hours). These indicators capture recurring operational schedules that may reflect time-varying occupancy, equipment operation, and control strategies, all of which may not be directly observable.
Weather sensitivity is incorporated through temperature-based regressors that are non-linear or piecewise linear functions of the outdoor air temperature.
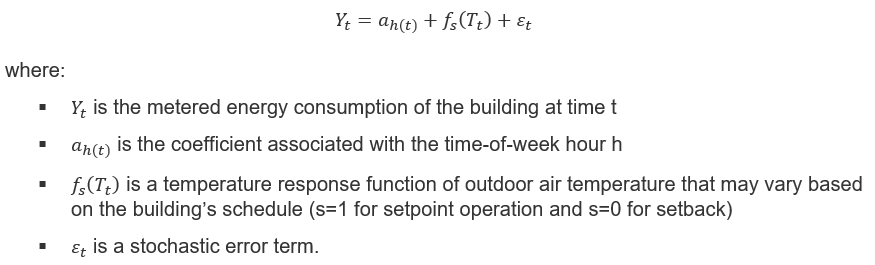
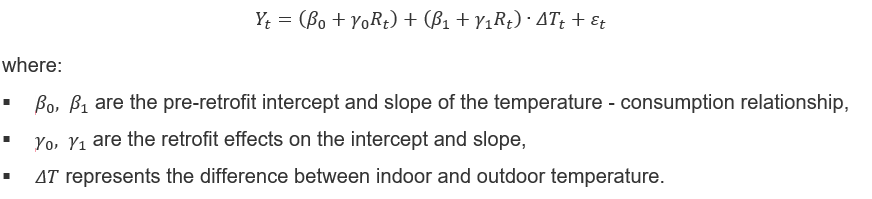
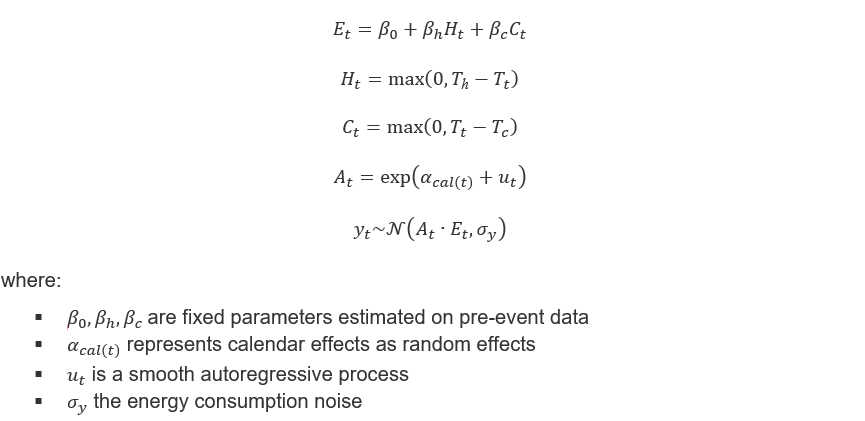
In its most general form, the TOWT model can be written as:
It is conceptually straightforward to imagine that the time-of-week component aims at approximating a hidden variable that reflects variations in the activity levels inside a building (operating schedule, number of occupants, recurrent activities that consume energy). If we introduce a variable A to represent these activity levels, then the causal relationships that govern the building’s energy consumption can be summarized as:
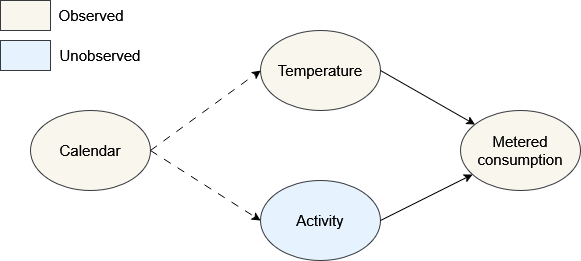
Fig. 4 – Causal relationships for building energy consumption
where:
- Calendar corresponds to calendar features (hour of day, day of week, week of year)
- Temperature is the outdoor air temperature
- Activity represents the activity levels
- Metered consumption is the energy consumption of the building.
The causal graph says that outdoor temperature directly affects energy consumption for heating and cooling, activity directly affects consumption by reflecting operations and time-varying levels of occupancy, and calendar features are correlated to both temperature and indoor operations. In addition, there is no causal relationship between temperature and activity.
In the absence of a mechanism to estimate activity levels from the observed data, we can replace activity with calendar features and use ordinary least squares (OLS) to estimate the parameters of the model. However, approximating activity with calendar features does not mean that the underlying causal relationships cease to exist or that the assumptions behind these relationships should not be monitored and verified. Accordingly, it is worthwhile to examine these assumptions in detail:
1. Activity is invariant to the retrofit. The assumption is that the retrofit changed efficiency (temperature response), not behaviour or operations. The implication is that for a given outdoor temperature, the distribution of the activity should be the same pre and post retrofit. Small deviations can be caused by a retrofit that introduces pre-heating or pre-cooling strategies, but the difference between the distributions should be small. If at any point the two distributions deviate significantly, the counterfactual prediction is not valid anymore.
2. Retrofit changes parameters, not structure. The baseline predictive model can be written as:
![]()
where θ represents the model’s parameters. The retrofit changes the parameters of the functional relationship between consumption and outdoor temperature ( for baseline period and for reporting period):

The Causal TOWT: a causal inference approach to M&V
Activity can be estimated based on the requirement that conditional on temperature, activity explains residual variation in energy. This is equivalent to requiring that the difference in energy consumption between two observations (one pre and one post retrofit) that have the same activity levels should be explainable by the impact of the retrofit on the building’s needs for heating and cooling energy.
The relationship between temperature and energy consumption can be defined as:
Accordingly, one way to estimate activity levels is through the Bayesian inference of the following model:
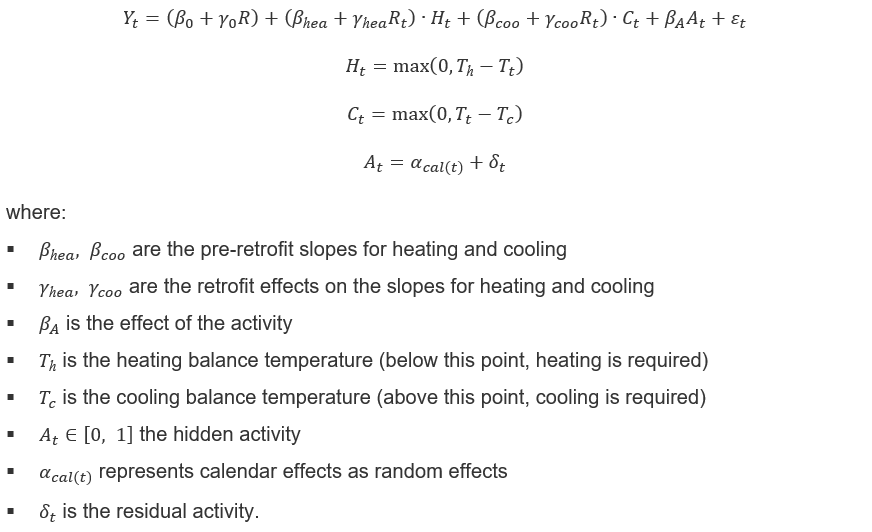
Given a mechanism for estimating activity, we can revisit the TOWT model and replace the calendar features with what they were trying to approximate; activity levels:
- For the baseline period, a predictive model is trained on observed outdoor temperature and estimated activity. The estimated activity acts as an anchor for the activity levels of the reporting period.
- During the reporting period, data from both periods are pooled to estimate only the post-retrofit activity. The counterfactual prediction for the energy consumption is obtained by applying the predictive model that was trained on baseline data onto the reporting period’s observed outdoor temperature and estimated activity.
Comparison between the TOWT and causal inference approaches
The most obvious difference between the TOWT model and the causal inference approach is that the latter is not a prediction task, because it uses the energy consumption after the retrofit to estimate the counterfactual: post-retrofit energy consumption is used for estimating post-retrofit activity levels, and post-retrofit activity is fed to the baseline model in the same fashion that post-retrofit outdoor temperature is.
While prediction tasks have favourable properties when it comes to testing and evaluating their accuracy, they typically include the following steps:
- Use historical data to train a predictive model
- Apply the model to get predictions for one of more time steps ahead
- Evaluate the accuracy of the model when receiving new data (by comparing the observed data to the predictions)
- Re-train or fine-tune the model using the newly received data.
This workflow is different from the workflow for M&V:
- Use historical data (baseline period) to train a predictive model
- Apply the model to get predictions over the reporting period
- Assume that the difference between observed energy consumption during the reporting period and predicted consumption is attributed to the retrofit.
In the M&V case, the true values for the counterfactual prediction are never observed. As a result, there are fewer opportunities for updating the predictive model so that it remains relevant for its task. However, the M&V goal is fundamentally a goal of devising and applying a mapping from states and conditions after an energy efficiency intervention to states and conditions before it. The impact of the intervention is the difference in energy consumption between matching states and conditions. When M&V is perceived as a mapping task, information extracted from the observed energy consumption during the reporting period can be used to improve the predictions of the model.
Additional differences between the two approaches can be identified through a toy simulation building. Using simulated models brings the benefit that the counterfactual is known and, as a result, the predictions can be evaluated using post-retrofit data. The simulation model has the following inputs:
- Outdoor air temperature.
- Occupancy profile. The distribution of the number of occupants (0 for no occupancy and 1 for maximum number of occupants) is:
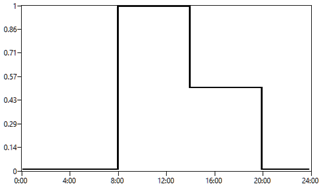
Fig. 5 – Default occupancy profile
The number of occupants at any time is calculated as the maximum (250) multiplied by the respective occupancy profile value, plus an autoregressive random term.
- Heating schedule. The heating system turns on if the average outdoor temperature during the heating hours (8:00-20:00) of the previous day was below 16 °C.
The baseline period includes the months January to June, while the reporting period the months September, October, November, and December. We will compare the two approaches under three (3) scenarios:
1. Efficiency upgrade. During the reporting period, the unit heat losses of the building (the heat losses for 1 degree difference between indoor and outdoor temperature) are 10% lower than the ones for the baseline period.
2. Activity shift. An activity shift occurs either when the maximum number of occupants (number of occupants at peak hours) changes or when the occupancy profile changes. More generally, an activity shift can be:
- A level shift (higher/lower average activity)
- A distributional shift
- A temporal reallocation (such as a change in the operating schedule).
For this scenario, we will take the case where the occupancy profile becomes:
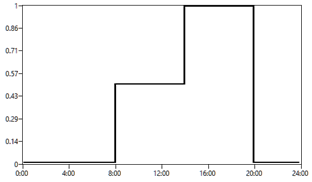
Fig. 6 – Activity shift
Scenario 1
The next plot shows the simulated energy consumption for the baseline and reporting periods:
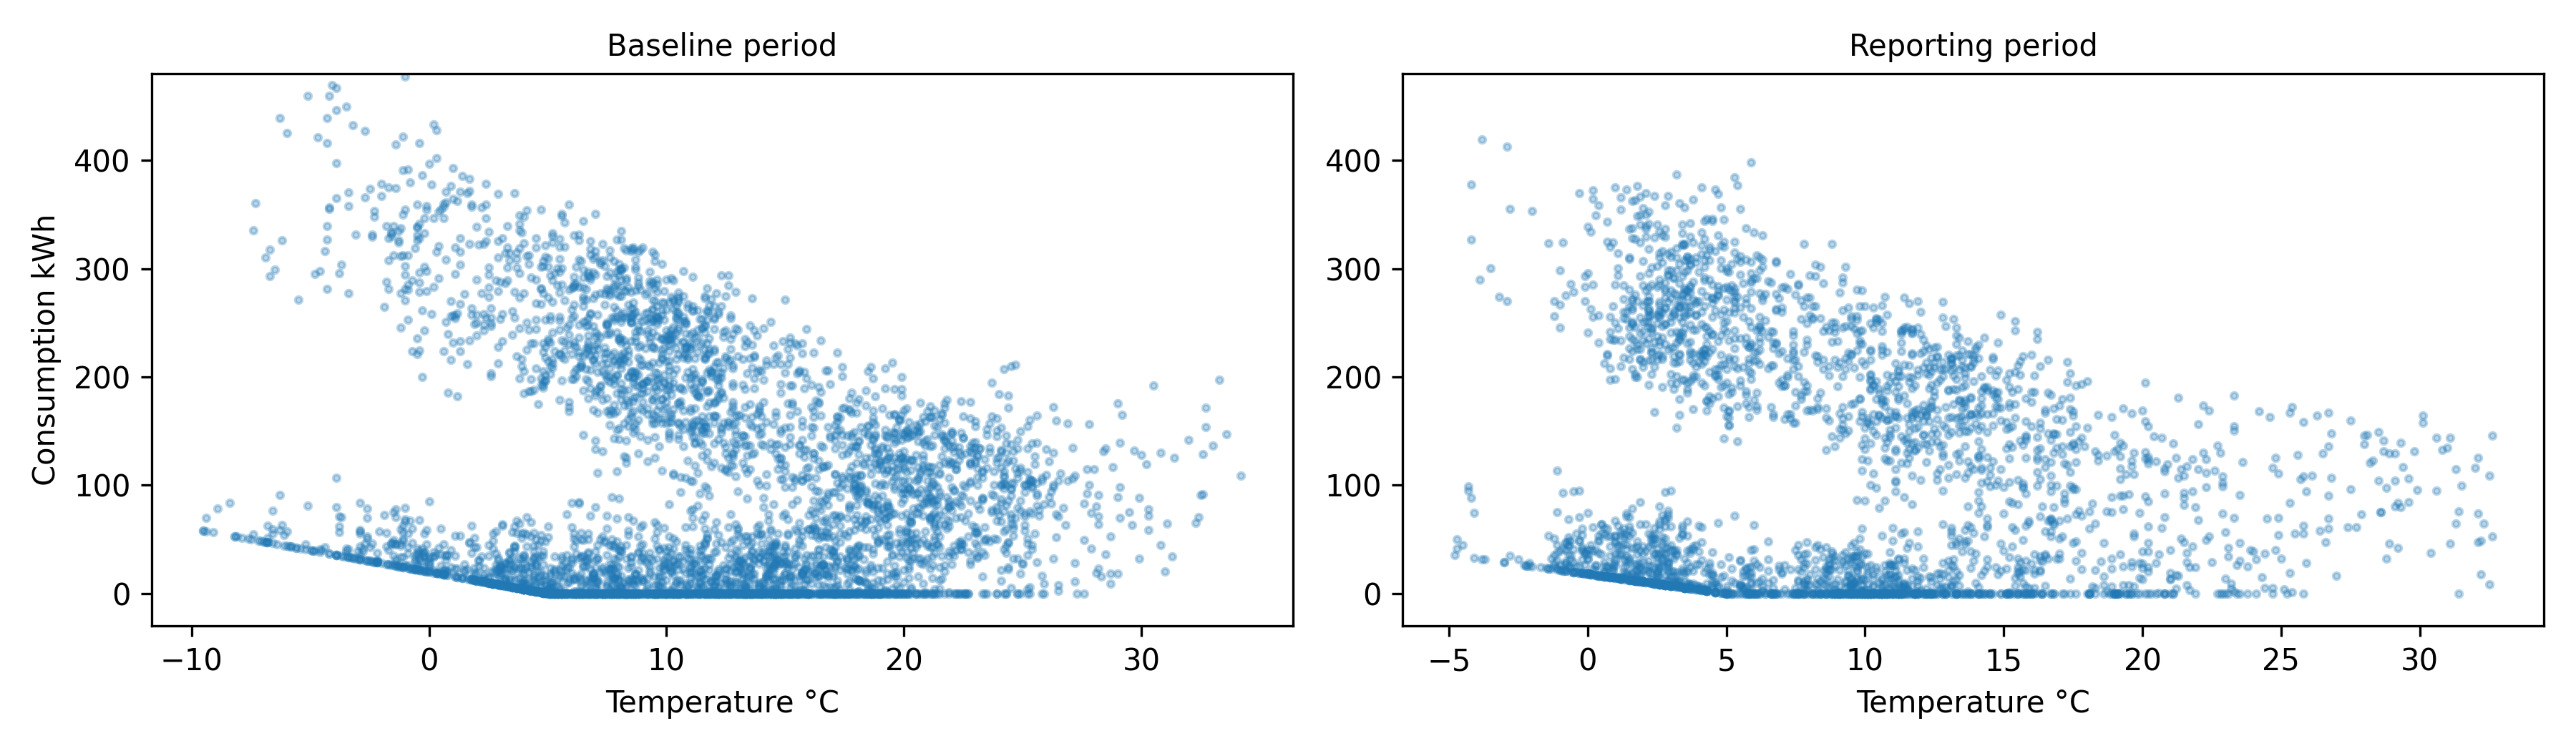
Fig. 7 – Baseline and reporting periods under first scenario
For the case of an efficiency upgrade, the TOWT model and its causal inference alternative (Causal TOWT) give similar results. The true counterfactual is calculated by passing the post-retrofit inputs to the pre-retrofit simulation model.
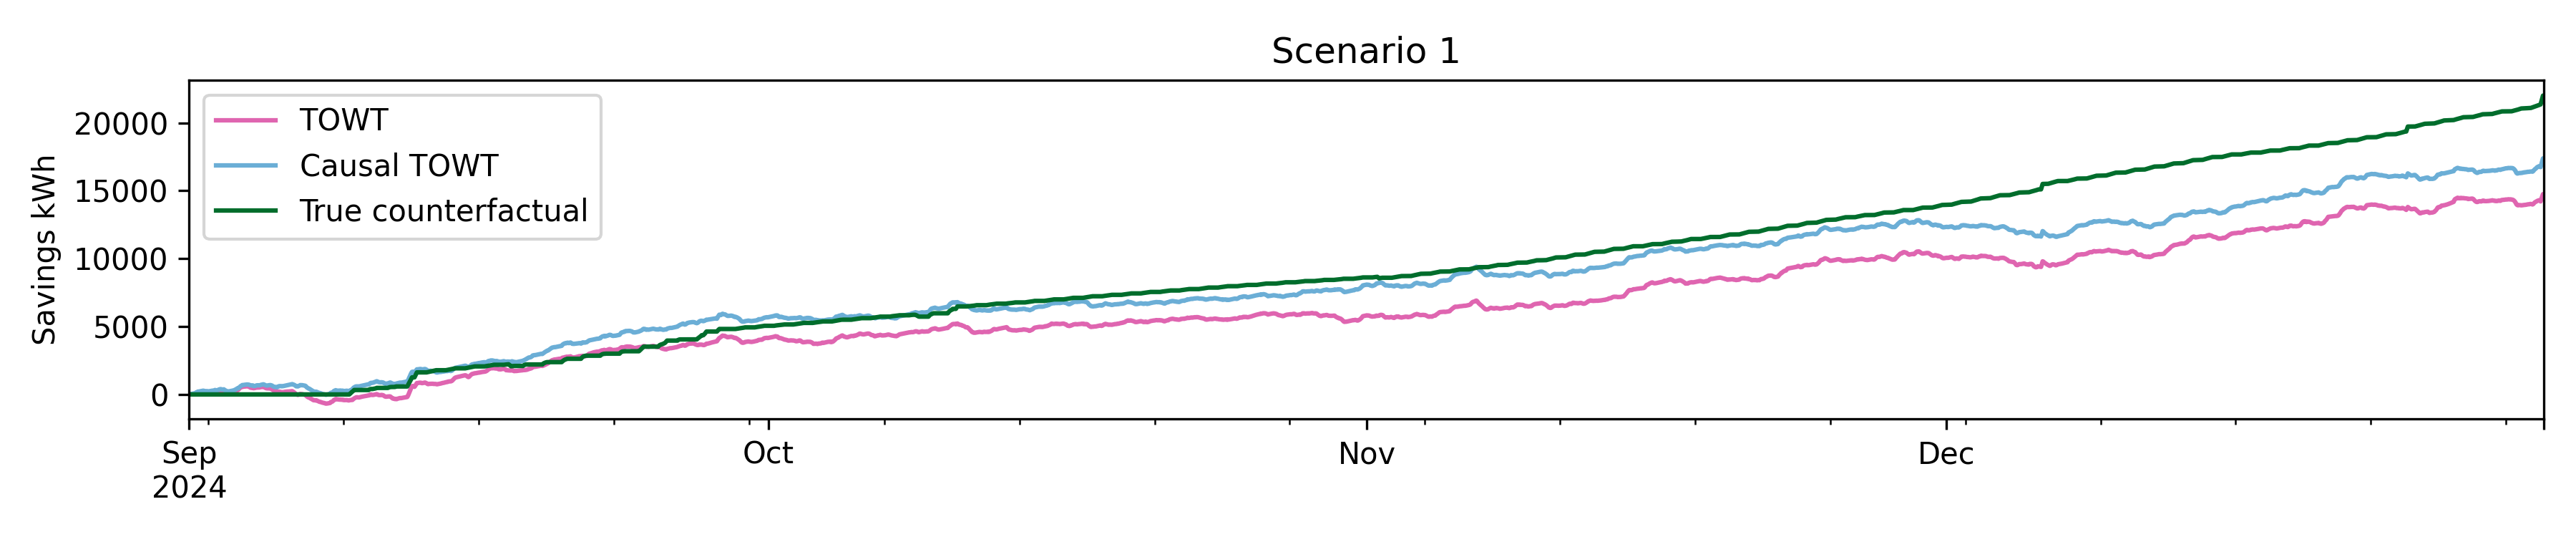
Fig. 8 – Comparison of TOWT and Causal TOWT under first scenario
Scenario 3
For the case of an activity shift, the true counterfactual leads to zero savings. In this case, the Causal TOWT model can adapt if it is informed that an activity shift has taken place. Detecting activity shifts is out of this article’s scope, but it is possible to monitor activity stability through time. Activity stability means that at the same temperature, the estimated activity orders operating regimes the same way before and after the retrofit, so that differences in energy consumption at fixed activity reflect efficiency rather than behaviour. If this requirement is not met, both the TOWT and Causal TOWT models, as well as any other predictive model, give invalid results.
However, the additional benefit of the Causal TOWT model is that given an activity shift event, it can estimate the new activity levels by answering the following question: “What activity trajectory best explains observed energy under unchanged building physics?” In other words, if the building’s efficiency has not changed, any change in energy use under the same outdoor conditions must come from how the building is being used. This change should be reflected in the updated activity levels.
The inverse problem is formulated as:
Since β0, βh, βc are fixed parameters, all unexplained systematic changes must go through the unknown activity.
The Causal TOWT model remains much closer to the true counterfactual compared to the TOWT, or any pure prediction model so that matter, since it already has a mechanism to explain energy consumption changes by adapting activity levels.
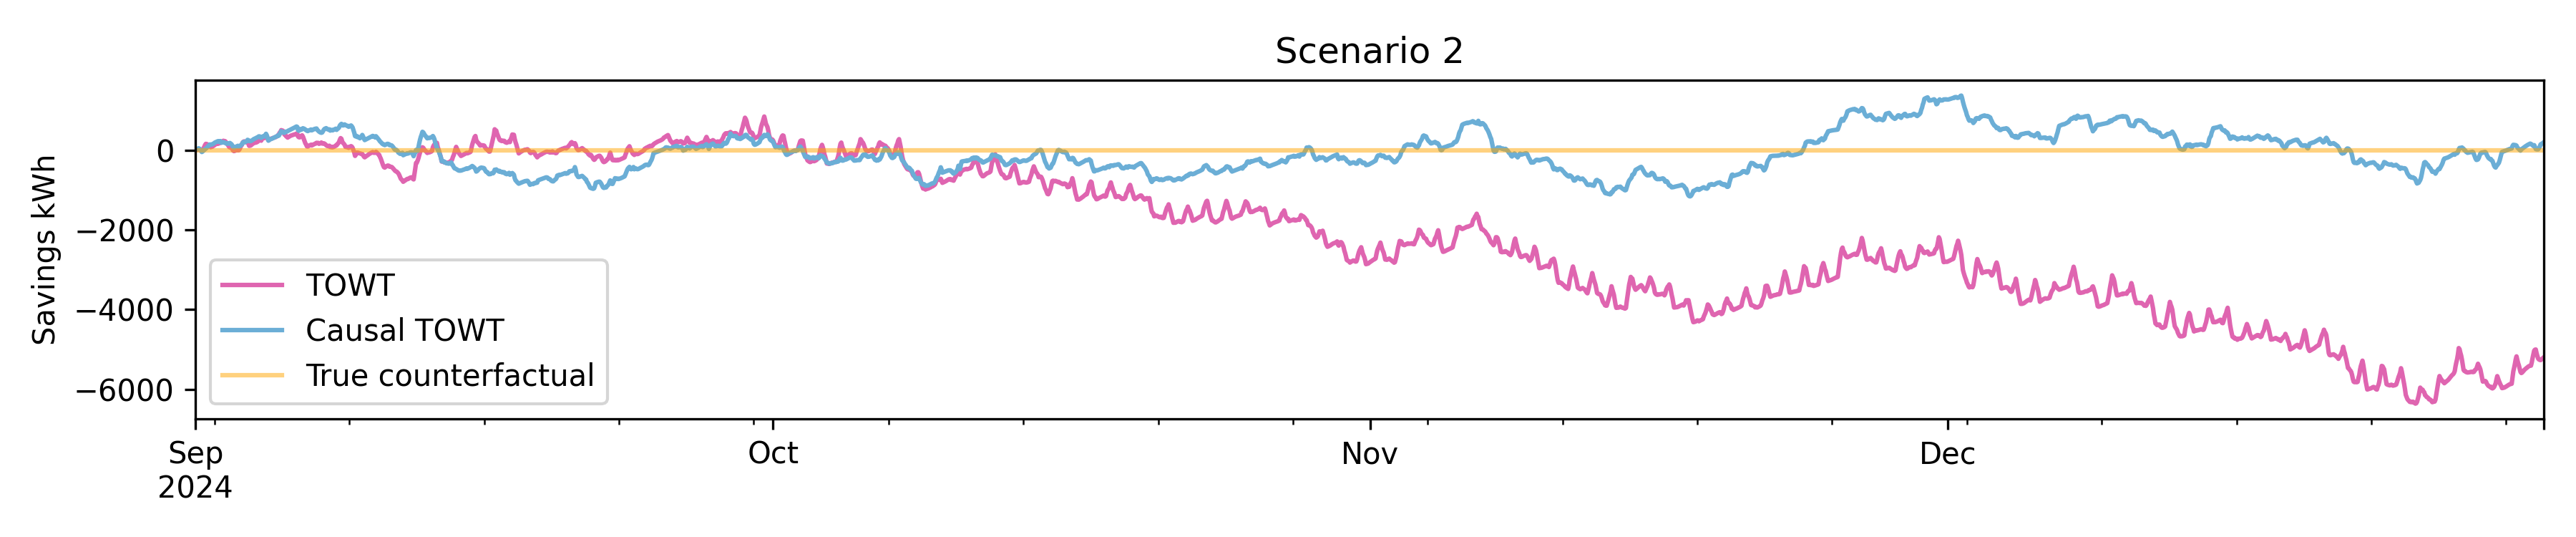
Fig. 9 – Comparison of TOWT and Causal TOWT under second scenario
Events that affect both efficiency and activity levels at the same time make identification and correction very difficult. There is an ongoing work on Meval4SRI that aims at defining the inputs that are required from users and the way these inputs will be used to deal with such combined events.
The Meval4SRI app includes a series of metrics and plots to evaluate the predictive model for a given dataset:
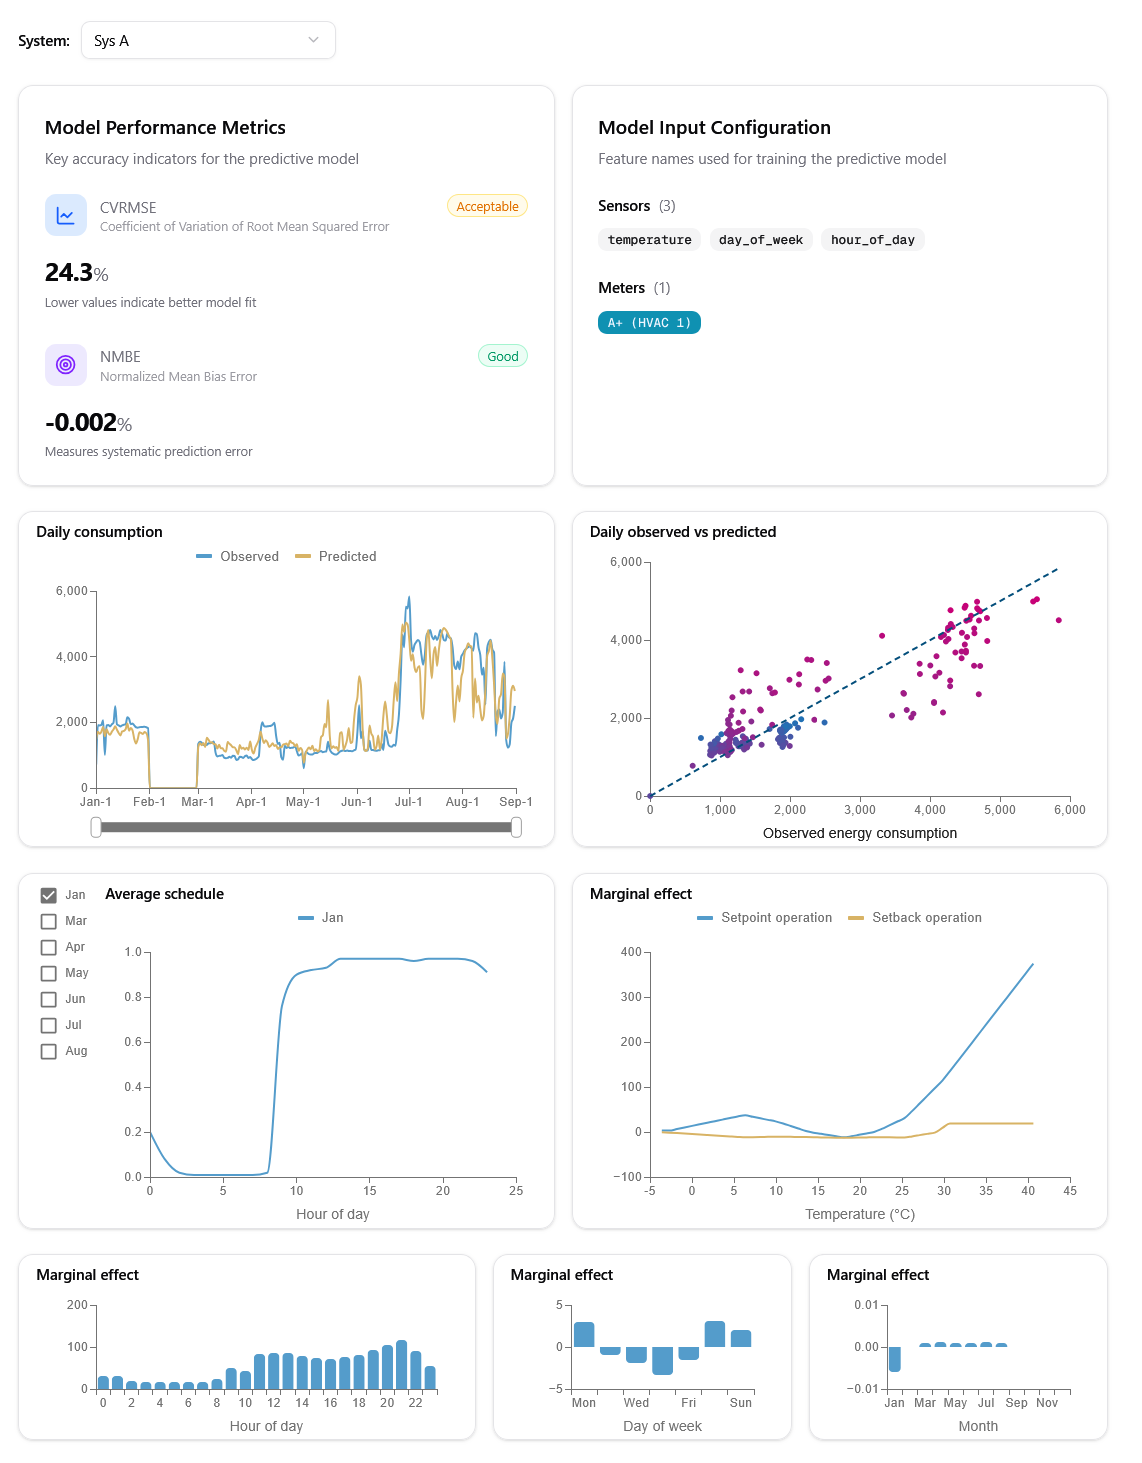
Fig. 10 – The model evaluation page
Acknowledgements
The development of the Meval4SRI tool has been funded by the European Union, under the Grant Agreement Nº 101077280. Views and opinions expressed are however those of the author(s) only and do not necessarily reflect those of the European Union or European Climate, Infrastructure and Environment Executive Agency (CINEA). Neither the European Union nor the granting authority can be held responsible for them.
(*) HEBES Intelligence
![]()