
By Colin Grenville*
The following is an exercise originally discussed in an interactive workshop session at the MAVCON’17 M&V conference in the U.K. in November 2017.
An Option C (whole facility) measurement approach is often proposed where numerous ECMs are installed at once and may have interactive effects which cannot be successfully isolated by local measurement. However, as M&V experience grows in U.K. energy services market we are increasingly discovering examples where using Option C is far from ideal. Using Option C introduces the real risk that changes in static factors (which could not reasonably be foreseen and considered when the M&V plan is written) could dwarf actual savings achieved by the installed ECMs. This risk increases where baseline data is not comprehensive and lacks proper schedules of installed energy consuming equipment. By the time a performance gap is identified, the chance of gathering baseline data may have passed, and calculating accurate non-routine adjustment becomes difficult or impossible.
The following is example is a modified version of a real project where Option C was used.
Project background
Facility electricity baseline annual demand is 200 MWh, at say £0.10/kWh = £20,000/annum.
4 variable frequency drives were installed to save 18 MWh/year = £1,800, i.e. savings represent 9% of baseline.
VFDs were commissioned with fixed reduced output which meets requirements for air flow and reduces excessive ventilation, i.e. no modulation of fan speed. Time clock control was added to match fan operation to occupancy hours. Each fan motor has a different kW rating.
Anticipated savings were derived from reduced fan power and reduced operating hours.
In order to avoid local metering at each ECM location, Option C was selected in the interests of minimising M&V cost, but unfortunately the following savings are observed using data from the main utility meter:
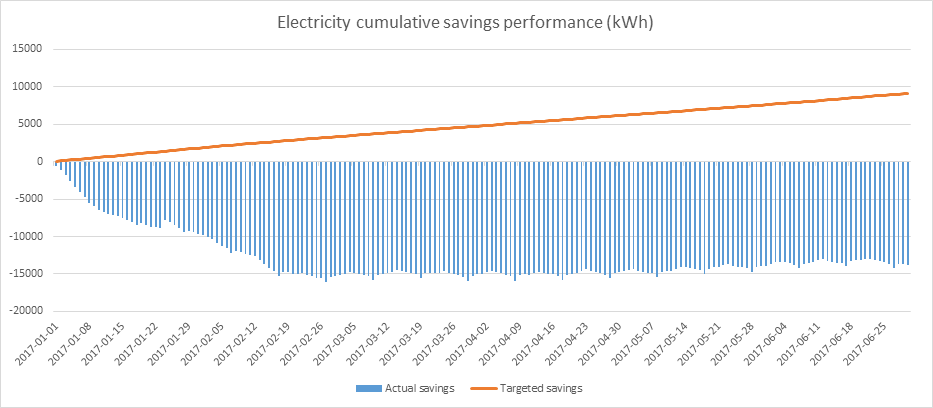
Investigations revealed the facility had introduced a significant new seasonal (space heating) electricity load at some time after the agreed baseline period and before start of measurement. The graph shows the impact of this change. Not only did the VFDs not apparently deliver their savings but it appears they caused an increase in the total site electricity use.
Questions for consideration:
1) What was wrong/went wrong with the measurement plan?
2) Is a non-routine adjustment appropriate in this situation? If so, how can you adjust?
3) How else could savings performance now be accurately calculated?
4) Should negative savings ever be reported if the ECM could not have caused the observed increase in electricity demand and no other explanation can be easily identified or should there be a floor on underperformance (e.g. zero savings)?
Please take the time to go through this exercice alone or in group within your company. Come back on March 21 for the solution.
NOTE: To see the solution, you must have an EVO website subscription. Please login into your account to see the solution and access M&V Focus additional interactive features. Follow this link to know more about EVO web subscriptions.

(*) Colin Grenville is the President of Erebus Environmental.