
![]() By Eric Oliver*
By Eric Oliver*
The acronym M&V is often used in the energy consulting world to represent two different concepts: “measurement and verification” and “monitoring and verification”. Measurement and verification—measuring energy consumed before and after an energy efficiency upgrade to quantify the actual energy saved from a project—is an important tool in energy upgrade projects, particularly energy savings performance contracts (ESPCs). Many building owners and end users require measurement and verification in ESPCs to verify that the ESCO is achieving savings that they are claiming (and getting paid for).
Monitoring and verification tracks energy usage over a longer time period (typically one year) to develop a more-complete picture of a building’s energy performance over time. This presentation deals specifically with monitoring and verification (herein referred to as M&V) and the way it can be greatly enhanced with the use of granular, detailed, real time energy monitoring.
An accurate, defendable M&V plan is inherently valuable to ESCOs as it justifies their bills to their clients. The growth and increased accessibility of real time energy monitoring (RTEM) can play a significant role in enhancing M&V strategies. A comprehensive RTEM platform involves installing sensors at the end-use of specific equipment—whether at individual breakers in an electrical panel or at a motor control center breaker—and recording consumption in real time. This data is then used to develop metrics to display and quantify the real effects of comprehensive energy upgrades. Utilizing RTEM to verify energy savings can be the most defendable, accurate M&V tool for energy service providers.
Building performance has been greatly enhanced by the incorporation of the “Internet of Things” (IoT), which is the concept of a multitude of electrical and mechanical devices connected to each other through the internet. When devices are connected, with the ability to both read data and offer control through other internet-connected devices, the potential exists to operate buildings at peak efficiency. This concept is recently being developed through the practice of real time energy monitoring (RTEM).
M&V methods and strategies are governed by the International Performance Measurement and Verification Protocol (IPMVP®), which were first established in 1997. The IPMVP provides four primary strategies for verifying savings, which they call options A, B, C and D and described below :
- Option A Retrofit Isolation: Key Parameter Measurement - Savings are determined by field measurement of the key performance parameter(s) which define the energy use of the energy conservation measure’s (ECM’s) affected system(s) and/or the success of the project.
- Option B Retrofit Isolation: All Parameter Measurement - Savings are determined by field measurement of all key performance parameters which define the energy use of the ECM-affected system.
- Option C Whole Facility: Savings are determined by measuring energy use at the whole facility or sub-facility level.
- Option D Calibrated Simulation: Savings are determined through simulation of the energy use using energy modeling software.
Each option has benefits and drawbacks depending on what type of energy conservation measure (ECM) is being verified.
For example:
- Option A can be used when an ECM is simple, as in a lighting retrofit where wattage of a fixture can be measured before and after retrofit and the measured savings can be used to extrapolate savings.
- Option D must be used if an upgrade is complex, as in a cooling system upgrade where a calibrated whole building energy model is really the only way to account for all of the changes that affect energy savings.
The growth and user-friendliness of real time energy monitoring has a significant role to play in enhancing M&V strategies. A comprehensive RTEM platform involves installing sensors at the end-use of specific equipment, whether at individual breakers in an electrical panel or at a motor control center breaker, and recording consumption in real time. This data is then used to develop metrics to display and quantify the real effects of comprehensive energy upgrades.
The images below show the actual real time energy consumption in one-minute intervals for a rooftop air handling unit in a school that was retrofitted with a variable speed drive (VSD).
Figure 1 represents the consumption for the week of March 12- 18 in one-minute increments. (The VSD was installed in March 18; therefore, there is data missing for that day.) The blue areas represent the measured consumption curve for the week (usage) and the green bands represent the range of historical data previously observed prior to this monitored week.
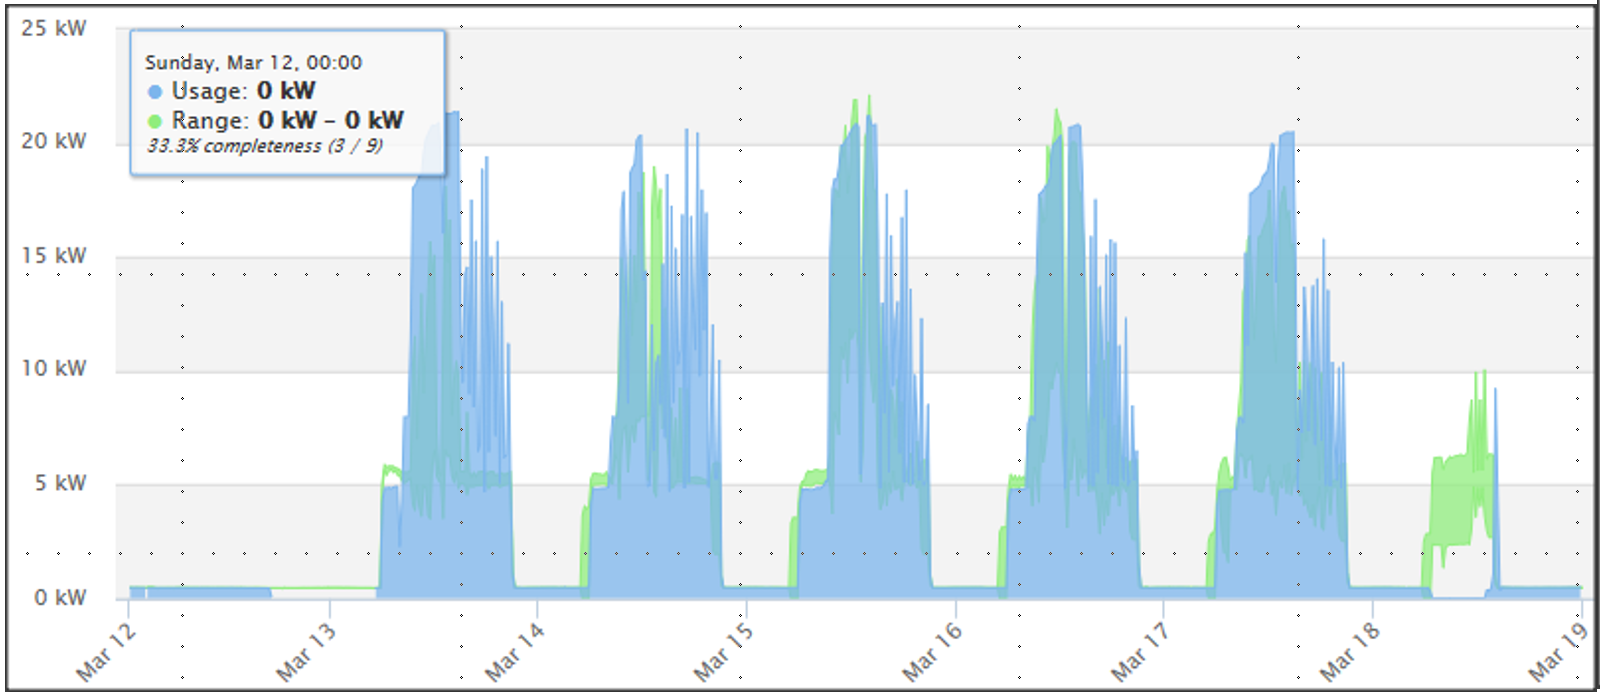
Figure 1. Rooftop Unit Electric Consumption March 12 -19
Figure 2 represents the seven days of consumption after the VSD was installed (March 19-26). You can visually notice a difference (operation and weather parameters were very similar pre- and post-installation).
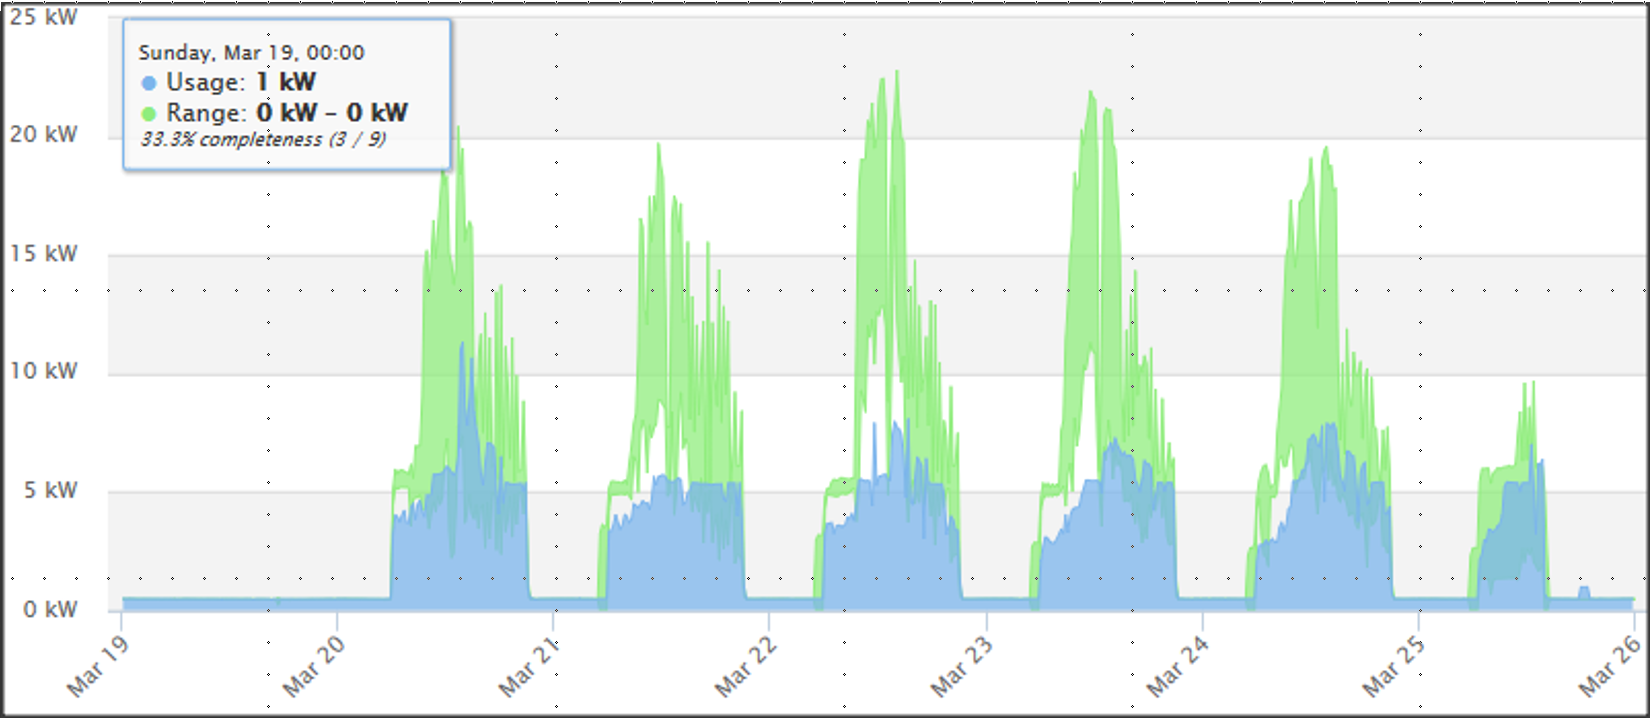
Figure 2. Rooftop Unit Post-installation Daily Consumption
To calculate true energy savings, all pre- and post-installation consumption data would need to be weather normalized. To accomplish this, both indoor and outdoor temperature and humidity data should be collected along with the consumption data. An example of this is shown in Figure 3.
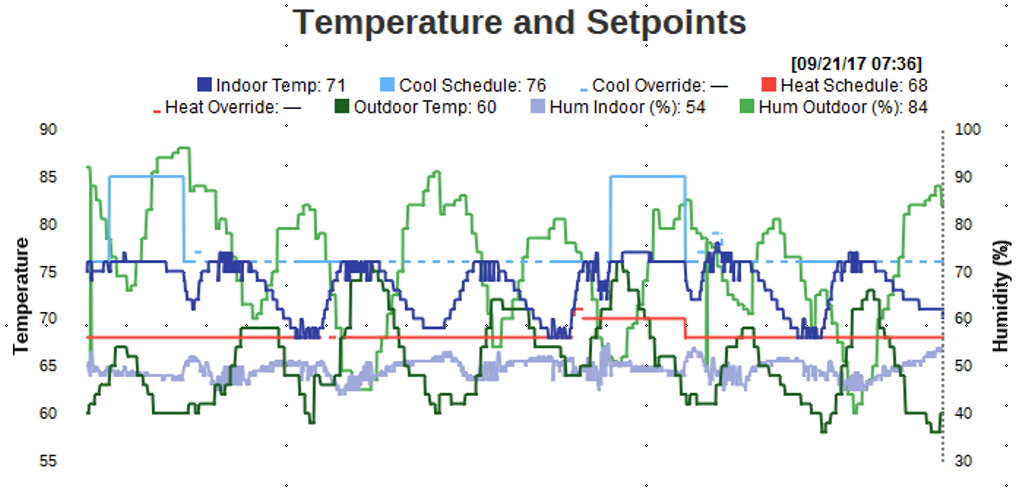
Figure 3. Real Time indoor and outdoor temperature and humidity data
There are two primary methods for weather normalizing real time data.
1. CDD/HDD manipulation. In this method, both sets of data (pre-installation and post-installation) are manipulated to represent the difference between observed weather data on the days monitored and TMY typical 30-year data. Therefore, by normalizing both sets of data to the same baseline weather data, pre- and post- consumption can be directly compared.
For example:
a. Assume a pre-installation day where a ground-mounted condensing unit used 46 kWh of electricity and the registered CDD for the day was 25.
b. Assume a post-installation day where a ground-mounted condensing unit used 51 kWh of electricity and the registered CDD for the day was 39.
c. Utilize these formulas to alter both sets of data to a new weather normalized baseline and the directly compare pre- and post-installation consumption.
2. Performance curves. Create regressions charts with a “best line fit” for consumption of the unit as a function of outside temperature. Create separate lines and equations for pre-installation data and post-installation data. The difference between the two lines can be used to calculate energy consumption before and after when applied to typical weather data.
In addition to providing accurate and defendable monitoring and verification of ECMs, the RTEM system can expose additional opportunities for energy savings and energy waste. Real time data from all circuits feed into a dashboard, where energy experts can recognize when consumption is above normal or above what’s expected and drill down to the specific circuit that is causing the energy waste. Performing data analytics for the kitchen of a school in California revealed that a significant amount of energy was being consumed at night. Drilling down further into the data, we identified a 6 kW food warmer that was cycling continuously at night, even though it was only used between 8:00 am and 1:00 pm (see Figure 4). Operators couldn’t tell by looking at it that it was on (the indicator light had failed) but shutting it down at night saved over 10,000 kWh with no additional cost.
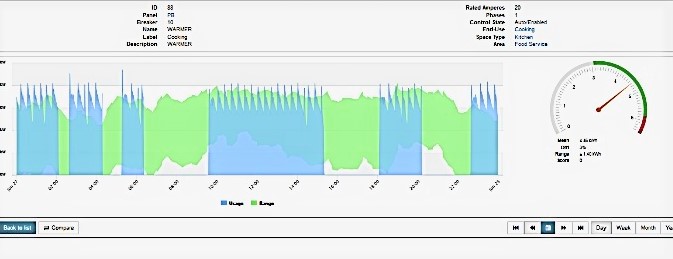
Figure 4. Food Warmer real time energy data for one day
Conclusion
The optimal way to incorporate RTEM into your M&V strategy is to install breaker-level monitoring nodes on all relevant energy-consuming breakers well prior to implementation. A minimum of six (6) months will allow accurate weather-normalized data to establish a defendable baseline. Once the ECMs have been implemented, post-implementation consumption can be calculated and extrapolated to a full year’s worth of consumption using new real time data. With each new day of data, the post-implementation extrapolation can be recalculated until a full year’s worth of data has been collected.

(*) Eric Oliver, PE, CEM, LEEDAP®, is Director of Energy Solutions at 2RW.