
![]() By Colin Grenville*
By Colin Grenville*
Normally, measurement of solar photovoltaic (PV) projects under the IPMVP is straightforward and Option B is a typical approach using directly metered data for generated electrical kWh. If the PV array is likely to export power to the local power distribution network, then capturing exported kWh is also important. Detailed guidance can be found in the IPMVP Renewables Application Guide, EVO 10200 : 1-2017.
Apart from a description of the metering (and data capture) arrangements the M&V plan should also include a description of the ECM intent, the tariff(s) involved in calculating avoided cost and other helpful text to highlight how missing data will be treated. It should also capture baseline conditions with respect to any factors likely to subsequently impact the performance of the installed solar ECM, for example local trees which may grow to over-shade the array and maintenance requirements and responsibilities. How might dust from adjacent construction projects impact upon the anticipated generation, and is cleaning the PV panels the responsibility of the ESCO or their client during the guaranteed savings period? One project in the U.K. was affected for several years by construction of a new tram line next to the building, with dust covering the solar panels and choking the cooling fans for the inverters resulting in overheating and premature equipment failure. The responsibilities captured in the M&V plan should concur with the Operation and Maintenance Manuals issued at the end of the ECM construction.
But what happens if the solar PV is not the original ECM installed by the ESCO, and instead is installed by their client later, without consideration of the ongoing M&V activity? The answer depends on how the original performance contract was being measured and what new metering is installed.
Such a situation arose in the U.K. a few years ago. In April 2010, a generous Feed-in Tariff was introduced to stimulate the development of a microgeneration market. Since then around one million arrays have been installed, the market has gained experience and competence, and issues of measurement and output performance management are better understood. Unfortunately, earlier installations were not all so well executed.
An ESCO had delivered an energy performance contract for their client, a local authority, across multiple facilities. All facilities had multiple ECMs installed and Option C (whole facility) was agreed as the measurement approach, with the measurement boundary set at the main incoming utility meters. Energy used on site was simply the metered imported gas and electricity. After several years, the local authority took advantage of the Feed-in Tariff opportunity and invested in numerous PV arrays across their estate. While these installations were typically designed to generate a peak kW output lower than the normal summer daytime import, the generosity and structure of the Feed-in Tariff encouraged maximisation of array size with any excess generation to be spilled to the local “grid”. Typical array size was in the order of 20 kW peak output.
The rules for obtaining the Feed-in Tariff payment required a MID compliant fiscal standard generation meter to be installed to capture the output of each array. However, the grid connection rules did not automatically require any export metering to be installed for arrays of this size. Consequently, no export metering was installed. Where export occurs,
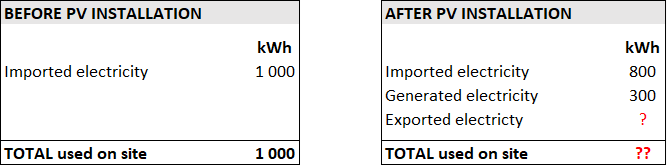
Total electricity used on site = Imported kWh + on-site generated kWh – exported kWh.
This presents a problem. In the absence of export metering, it became impossible to accurately calculate how much power had been used on site. Looking at a deliberately simplified example, in the “after” figure below, was all the generated electricity used on site, was it all exported to grid or was a proportion of it used on site? The total kWh used on site could be anywhere between 800 kWh and 1,100 kWh.
How much uncertainty this creates in the reporting savings depends on the scale of the missing data in relation to the anticipated savings from the ECMs installed by the ESCO.
How was the problem identified?
I’d like to say it is was spotted as part of periodic site visits by the ESCO to check for changes in static factors. However, it was identified after the ESCO submitted an annual savings report which showed above expected savings, at which point the local authority raised the subject of numerous PV arrays that the ESCO knew nothing about. A responsibility to notify the ESCO of any material changes was included in the M&V plan but this had not happened, and the notification was only prompted by the arrival of the annual report. The report needed to be revised to consider the PV generation as kWh used rather than avoided, but a methodology was required to determine what proportion of the generation had been used on site and not exported.
Solutions
Having inadvertently created a measurement problem, the local authority retrospectively installed export metering on all sites, even where export had not yet occurred. This permanent solution future-proofed them in the event of further reductions in on site energy demand. However, in the meantime the period between original PV installation and subsequent export meter installation required a novel temporary approach to estimate the proportion of PV generation that was spilled to grid unmetered.
All the sites in question had half-hourly (HH) interval data available for imported electricity, and the new PV generation meters also produced HH data.
The ESCO reviewed the tables of HH data and in each reporting period before permanent export metering was installed:
- For all HH periods where imported kWh was > 0, the imported and generated kWh were added together to calculate total kWh used on site in that HH period.
- Using simple conditional formatting in Microsoft Excel, cells were highlighted for all HH periods during daylight hours where imported electricity = 0 kWh. In these periods, it was unclear whether this was genuine zero demand (unlikely based on historic data), or whether this was normal demand but zero import.
- For all HH period where imported electricity = 0, the corresponding HH periods of PV generation were summed across the whole reporting period. This gave a maximum uncertainty where the totalled generation could either have been wholly used on site, wholly exported, or partially used on site (see figure below):
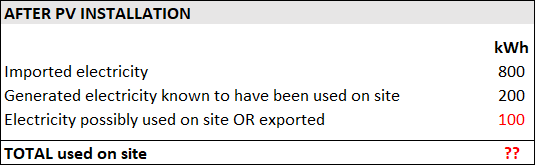
Now the range of possible on-site usage has been reduced from 800 – 1100 kWh to a range of 1000 – 1100 kWh, a reduction in uncertainty of 200 kWh. The residual problem was to agree what proportion of the remaining 100 kWh might have been exported. Given that the absolute value of uncertain usage was low, the ESCO and their client split the risk between them. Clearly, some export probably occurred during these periods but, reflecting that this uncertainty was created by the client for which the ESCO should not be at increased risk of underperformance penalties, the proposed solution was to assume that somewhere >50% was exported.
Summary
Regular dialogue between ESCO and their client is essential following ECM installation to avoid surprises like unexpected and unmetered client ECMs. These discussions should form part of the periodic re-inspection of installed ECMs and review of other static factors. Not all client installed ECMs will be visible and good questioning is valuable to tease out unseen ECMs like changes to control settings or PV panels mounted on a flat roof.
Image by Ulrike Leone, Pixabay

(*) Colin Grenville, EngTech MEI CMVP ACIBSE PIEMA | CIBSE Low Carbon Consultant LCC171753
Director, Erebus Environment Limited